There are no items in your cart
Add More
Add More
| Item Details | Price | ||
|---|---|---|---|

A web-based menu engineering app built for restaurants, cafés, cloud kitchens, hotels, and food businesses that want to analyse menu performance using profitability, popularity, contribution margin, food cost, sales quantity, and clear action priorities.
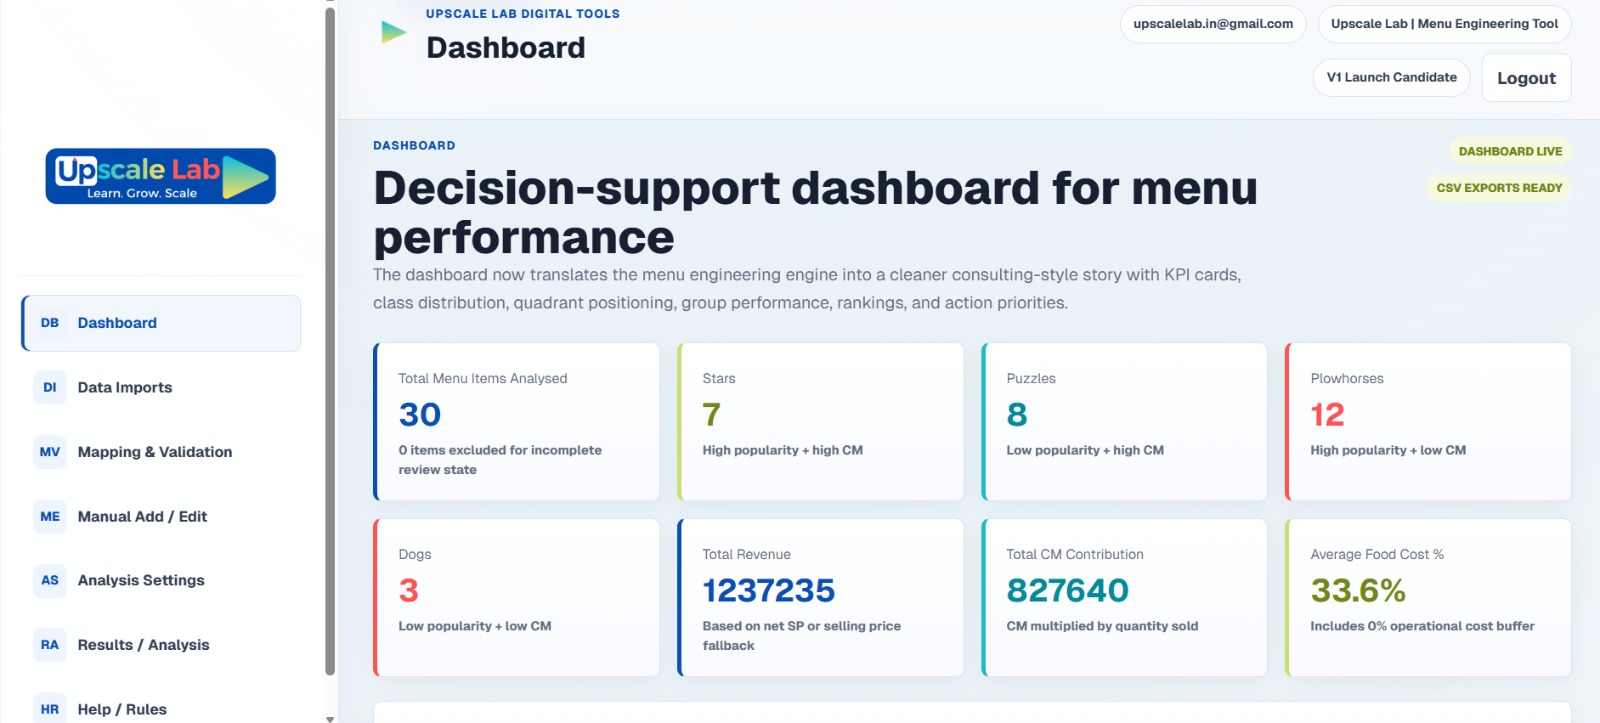
A decision-support dashboard for contribution, popularity, class, and menu performance.
The Menu Engineering System helps you bring together food cost, menu price, sales quantity, contribution margin, and popularity data — so every dish can be reviewed with structured logic instead of instinct.
Analyse every menu item using both contribution margin and sales performance.
Classify items into Stars, Puzzles, Plowhorses, and Dogs for clearer decisions.
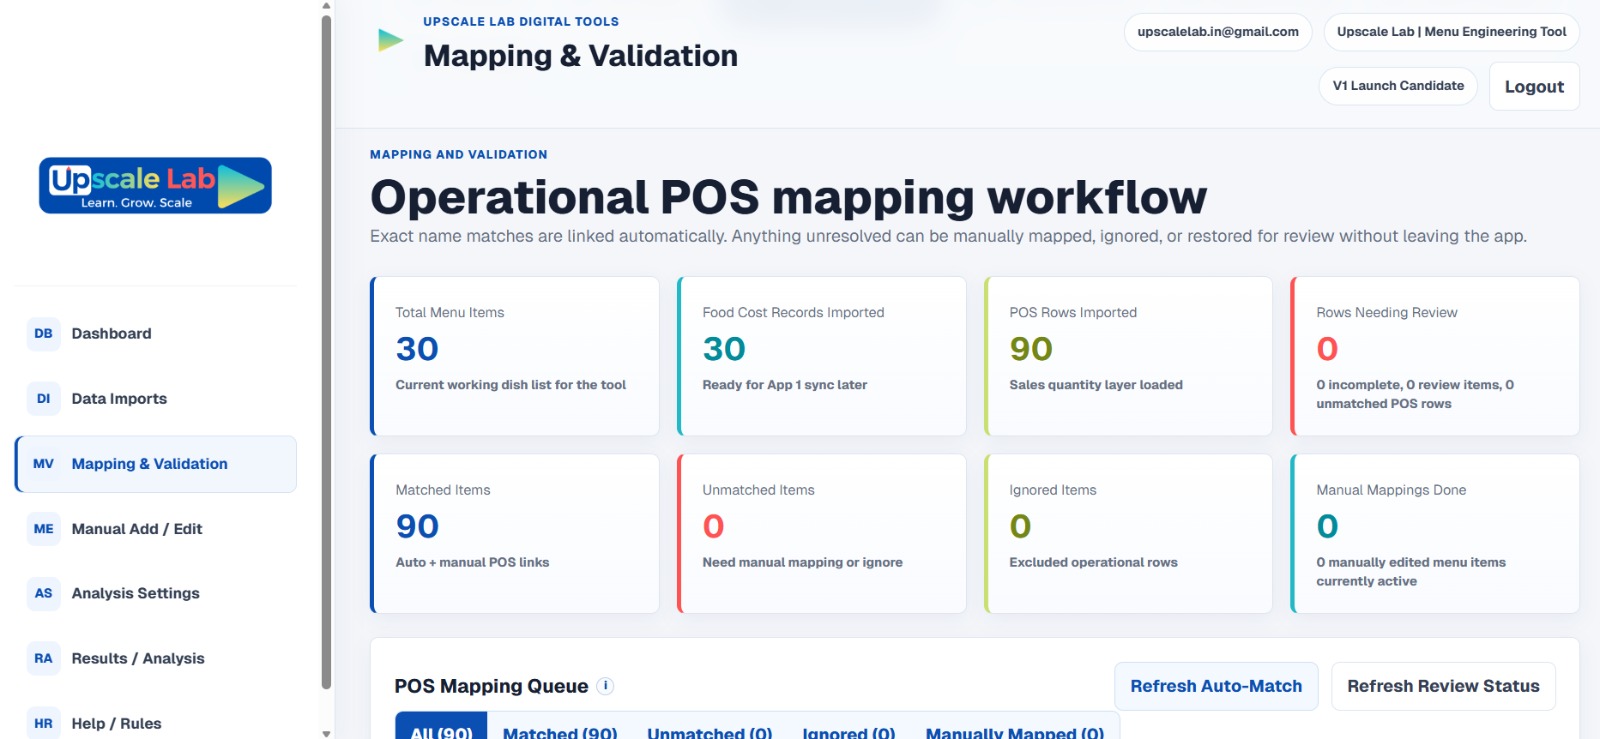
Map POS sales data with menu items so your analysis is based on actual performance.
Identify what to push, fix, reprice, monitor, or remove from the menu.
Many food businesses know which items sell, but they don’t know which items truly contribute to profit. Without connecting sales quantity, selling price, food cost, and contribution margin, menu decisions become incomplete.
A popular item can still weaken margins if its contribution is low.
Some dishes may sell less but contribute strongly when positioned correctly.
Prices are increased, discounted, or left unchanged without structured contribution logic.
Sales reports and recipe costing often exist in different places, making decisions difficult.
Items remain on the menu because of habit, preference, or fear — not because of performance.
Even after seeing numbers, operators need clear direction on what to push, fix, reprice, or remove.
The Upscale Lab Menu Engineering System helps food businesses analyse their menu using structured business logic. It connects food cost, selling price, POS quantity, contribution margin, popularity, engineering group, and item classification into one decision-support workflow.
It is designed for operators who want to stop looking at menu performance only through sales and start understanding which items are actually building profit, creating pressure, or needing corrective action.
From data imports to classification and action outputs, the system is built around the practical workflow of menu engineering.
Upload food cost records, menu master data, and POS sales data into the system.
Match menu items with POS records and review unresolved or unmatched items.
Complete missing details, correct item records, adjust categories, and clean data before analysis.
Set benchmarks and assumptions that guide classification and decision outputs.
Review menu performance through KPI cards, contribution, popularity, and class distribution.
Classify items into Stars, Puzzles, Plowhorses, and Dogs using menu engineering logic.
Visualise how items perform across popularity and contribution margin.
Export results for review, presentation, business discussion, or deeper consulting work.
The system is designed to help operators move from raw menu data to structured decision-making. Each screen supports a specific stage of the menu engineering workflow.
A decision-support dashboard for menu performance with KPI cards, class distribution, and action priorities.
Load, validate, and review the three core data layers — food cost records, menu master, and POS sales data.
Match POS sales data with menu items and review unresolved records before analysis.
Complete or correct dish records without depending only on uploads.
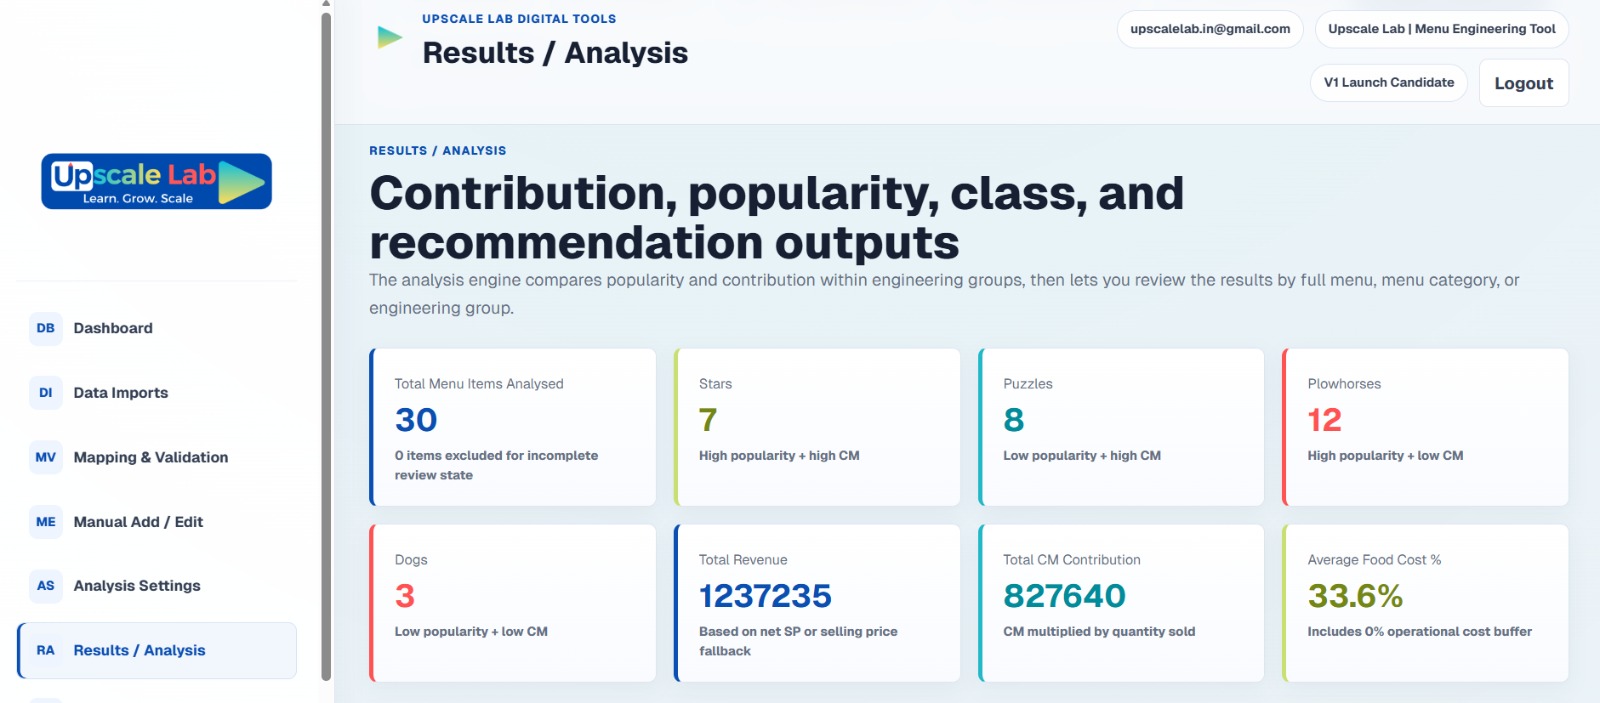
Review contribution, popularity, class, and recommendation outputs in one structured dashboard.
Understand how items are distributed across Stars, Puzzles, Plowhorses, and Dogs with quadrant view.
Review group-level performance with quantity, revenue, contribution margin, food cost percentage, and average CM per dish.
Use ranked outputs and export-ready reports for review, discussion, and business action.
Watch the step-by-step tutorial on YouTube to understand how to upload data, validate records, map POS items, set analysis logic, and read the menu engineering results.
The tutorial opens on YouTube so viewers watch directly on the channel.
Follow a clear sequence from food cost and POS data to menu classification, performance analysis, and action priorities.
Bring in food cost records from your costing system or prepared data file.
Upload menu master and POS sales quantity data for performance analysis.
Match dish names, resolve unmatched items, and clean incomplete records.
Define the logic needed for popularity, contribution, and classification.
Analyse Stars, Puzzles, Plowhorses, Dogs, contribution margin, and popularity.
Use the output to decide what to promote, reprice, improve, retain, or remove.
Whether you run a single outlet, cloud kitchen, café, hotel F&B operation, or consulting project, the system helps you analyse menu performance with structured clarity.
Understand which menu items are driving profit and which are only creating sales volume.
Identify fast-moving items, margin-sensitive items, and pricing opportunities.
Review delivery-led menus where sales volume, platform pressure, and margins need sharper control.
Analyse menu performance across categories, outlets, or operational groups.
Use structured outputs to support menu review, pricing decisions, and client recommendations.
Build a menu with better pricing and profitability logic from the beginning.
Manual review may tell you which items sold. A menu engineering system helps you understand which items deserve attention, promotion, correction, or removal.
Use the system before menu redesigns, price corrections, promotions, expansion planning, or performance reviews.
Understand which items deserve better placement, visibility, or removal.
Identify where price correction is justified based on food cost and contribution.
Avoid promoting items that sell well but weaken margins.
Check whether an item is truly weak or simply under-promoted.
Build a menu performance logic before replicating the menu across formats.
Review sales, contribution, popularity, and category performance with structured data.
A web-based menu engineering app to analyse menu performance using food cost, selling price, sales quantity, contribution margin, popularity, and classification logic.
Lifetime access will be activated for the email used during purchase.
Menu engineering gives you clarity on item-level performance. Once you know what your menu is doing, you can use that data to improve pricing, redesign the menu, control food cost, and build stronger business systems.
Calculate recipe cost and food cost percentage before menu engineering.
Explore Food Cost Calculator →Understand where your food business is leaking profit and what to fix first.
Book a Diagnostic →Understand the bigger system behind food cost, pricing, menu engineering, and profit control.
Join Masterclass →Here are the important things to know before purchasing the Menu Engineering System.
No. This is a web-based menu engineering app. It may allow exports, but the product itself is an app.
You need food cost data, menu price or menu master data, and POS sales quantity data for the best analysis.
Yes. Food cost clarity is important because contribution margin depends on the relationship between selling price and cost.
It classifies items into Stars, Puzzles, Plowhorses, and Dogs based on popularity and contribution logic.
Yes. The app includes manual add/edit and mapping workflows to clean records before analysis.
It gives structured outputs and action priorities. Final decisions should still consider brand, operations, customer demand, and strategy.
Yes. Export-ready outputs can be used for review, discussion, or consulting work.
Yes. The launch offer includes lifetime access to the Menu Engineering System for the email used during purchase.
Yes. Food cost data becomes one of the strongest foundations for menu engineering because it helps calculate contribution and performance logic more clearly.
Before you redesign, reprice, promote, or remove items, understand how each dish performs across sales, contribution, and popularity.
 Launch your Graphy
.jpeg)
.jpeg)
.jpeg)
.jpeg)
.jpeg)